3QFY2019 Result Update | Consumer Durable
February 16, 2019
Amber Enterprises India Ltd
BUY
CMP
`637
Performance Update
Target Price
`910
(` cr)
3QFY19
3QFY18
% yoy 2QFY19
% qoq
Investment Period
12 months
Revenue
388.8
338.4
14.9
226.3
71.8
Stock Info
EBITDA
22.1
24.1
(8.2)
8.9
148.9
Sector
Consumer Durable
OPM (%)
5.7%
7.1%
3.9%
Market Cap (` cr)
2,002
Reported PAT
3.9
0.1
3123
-1.8
(320.0)
Net Debt (` cr)
-62.0
Source: Company, Angel Research
Beta
0.9
For 3QFY2019, Amber Enterprises Ltd (Amber) posted a decent set of numbers
52 Week High / Low
1200/630
given muted demand environment and significant cost pressures. Revenue grew
Avg. Daily Volume
12,500
by 14.9% yoy to `338.8cr. On the bottom-line front, Amber reported PAT of
Face Value (`)
2
BSE Sensex
35,809
`3.9cr against `0.1cr despite cost pressures.
Nifty
10,724
Growth led by AC Components Division: The company’s top-line grew by 14.9%
Reuters Code
AMBER.BO
yoy to `338.8cr on the back of strong volume growth. Growth was led by strong
Bloomberg Code
AMBER.IN
performance of the AC Components division which accounted for 8.8% of
revenues in Q4FY19 as compared to 5.9% of revenues in Q3FY18. Growth in the
Shareholding Pattern (%)
air conditioner segment was sluggish due to weakness in overall demand and
Promoters
44
therefore its contribution dropped to 78.4% of revenues from 80.9%. Non AC
MF / Banks / Indian
33
FII / NRIs / OCBs
11
components contributed to 12.8% of revenues as compared to 13.2% of revenues
Indian Public/Others
12
in Q3FY18.
Margins Impacted Due to Cost Pressures: On the operating front, the company’s
Abs.(%)
3m
1yr
3yr
gross margins declined by 160bps to 14.1% due to cost pressures. EBITDA
Sensex
1.6
4.4
52.0
margins also declined by 130bps yoy to 5.7%. However lower interest outgo an
Amber
(25.9)
(44.6)
-
stable tax rates led to increase in PAT from Rs. 0.1cr to Rs. 3.9cr.
Outlook and Valuation: We expect Amber Ltd. to report net profit (reported)
CAGR of ~35.5% to ~`114.4cr over FY2018-20E on the back of topline growth
of 19.4% in the same period. Post the 3QFY19 numbers, we maintain BUY on the
stock with a revised target Price of `910 (25xFY20E).
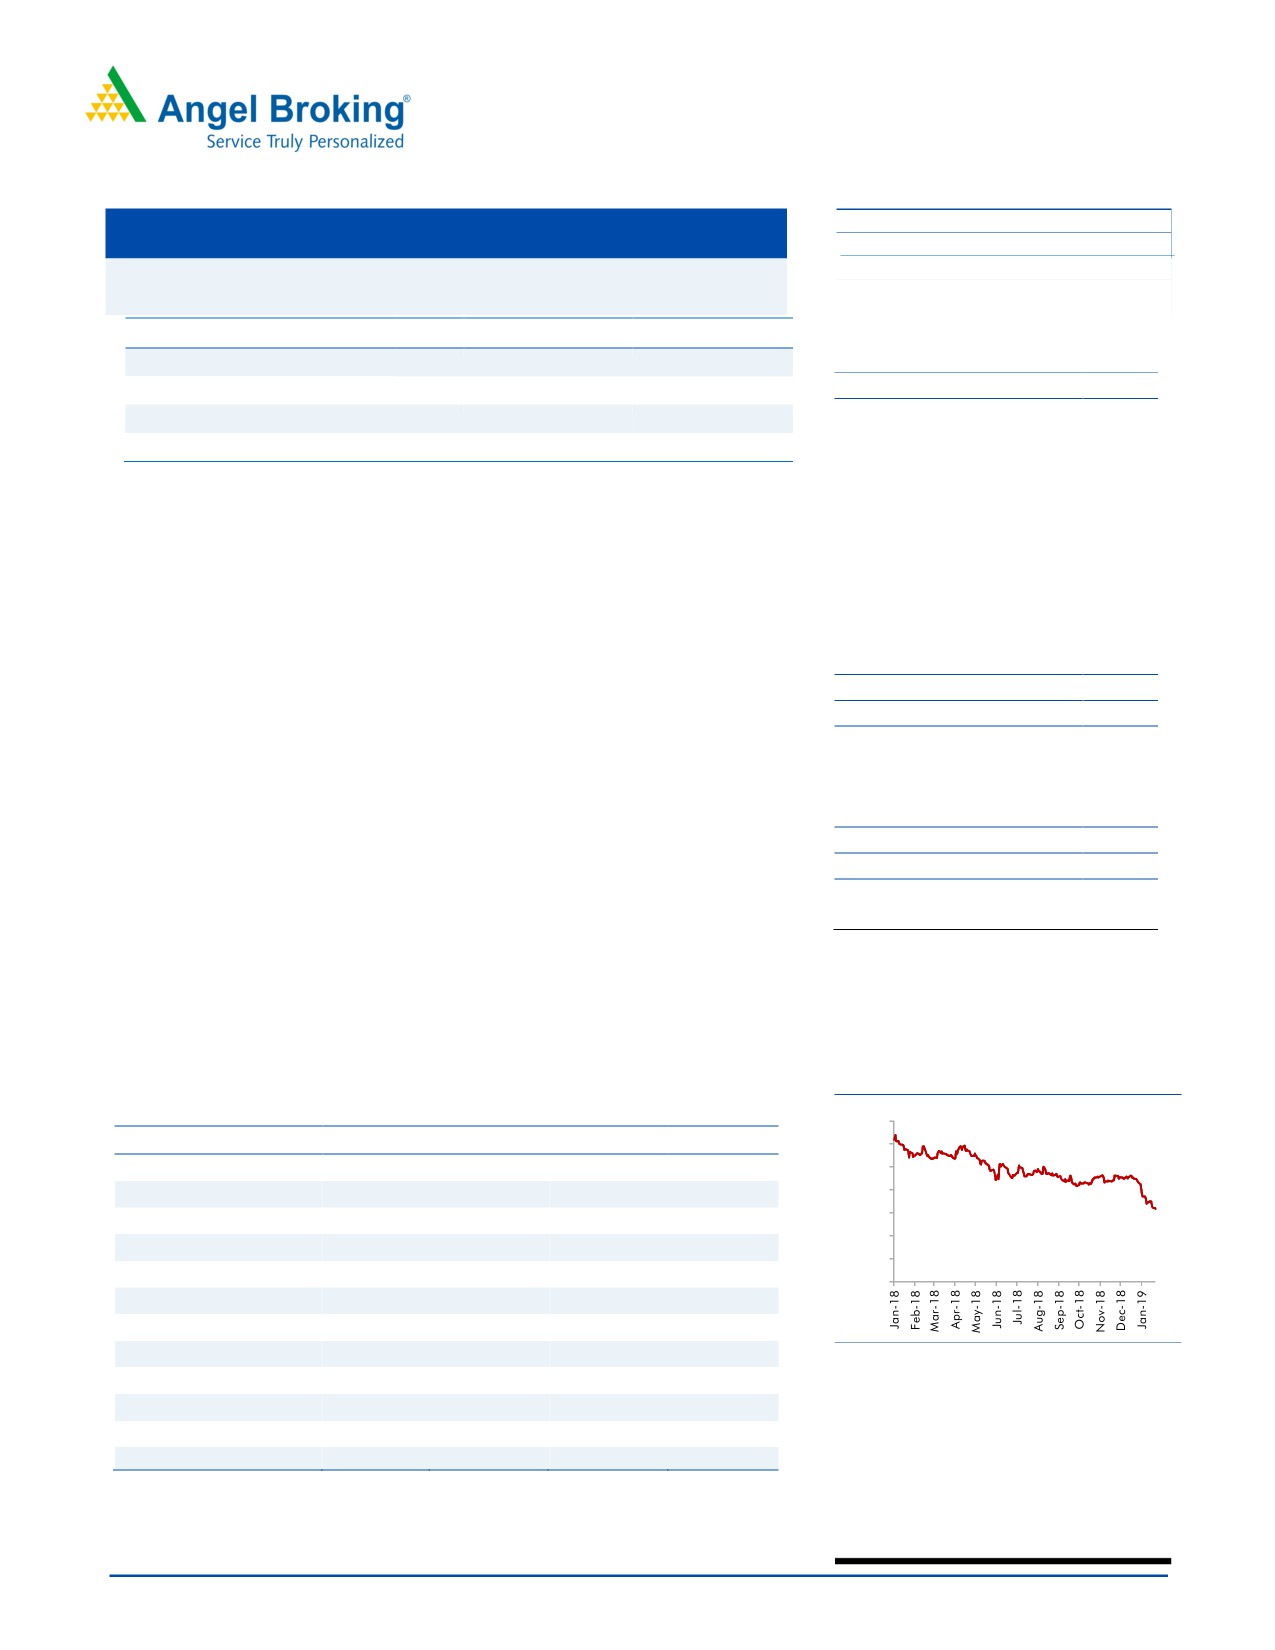
Historical share price chart
Key Financials
1,400
Y/E March (` cr)
FY2017
FY2018
FY2019E FY2020E
1,200
Net sales
1,651.9
2,128.1
2,500.5
3,034.7
1,000
800
% chg
51.7
28.8
17.5
21.4
600
Adj. Net profit
25.2
62.3
89.1
114.4
400
% chg
4.5
147.4
43.1
28.4
200
EBITDA margin (%)
7.9
8.6
7.5
7.5
0
EPS (`)
8.0
19.8
28.3
36.4
P/E (x)
79.5
32.1
22.5
17.5
P/BV (x)
6.0
2.2
2.1
1.9
Source: Company, Angel Research
RoE (%)
7.5
7.0
9.2
10.8
RoCE (%)
13.3
13.5
12.8
14.9
Amarjeet S Maurya
EV/Sales (x)
1.4
0.9
0.7
0.6
022-40003600 Ext: 6831
EV/EBITDA (x)
17.5
10.4
9.6
7.8
Source: Company, Angel Research Note
Please refer to important disclosures at the end of this report
1
Amber Enterprises India| 3QFY2019 Result Update
Research Team Tel: 022 - 39357800
DISCLAIMER
Angel Broking Limited (hereinafter referred to as “Angel”) is a registered Member of National Stock Exchange of India Limited, Bombay
Stock Exchange Limited and Metropolitan Stock Exchange Limited. It is also registered as a Depository Participant with CDSL and
Portfolio Manager and Investment Adviser with SEBI. It also has registration with AMFI as a Mutual Fund Distributor. Angel Broking
Limited is a registered entity with SEBI for Research Analyst in terms of SEBI (Research Analyst) Regulations, 2014 vide registration
number INH000000164. Angel or its associates has not been debarred/ suspended by SEBI or any other regulatory authority for
accessing /dealing in securities Market. Angel or its associates/analyst has not received any compensation / managed or co-managed
public offering of securities of the company covered by Analyst during the past twelve months.
This document is solely for the personal information of the recipient, and must not be singularly used as the basis of any investment
decision. Nothing in this document should be construed as investment or financial advice. Each recipient of this document should
make such investigations as they deem necessary to arrive at an independent evaluation of an investment in the securities of the
companies referred to in this document (including the merits and risks involved), and should consult their own advisors to determine
the merits and risks of such an investment.
Reports based on technical and derivative analysis center on studying charts of a stock's price movement, outstanding positions and
trading volume, as opposed to focusing on a company's fundamentals and, as such, may not match with a report on a company's
fundamentals. Investors are advised to refer the Fundamental and Technical Research Reports available on our website to evaluate the
contrary view, if any
The information in this document has been printed on the basis of publicly available information, internal data and other reliable
sources believed to be true, but we do not represent that it is accurate or complete and it should not be relied on as such, as this
document is for general guidance only. Angel Broking Limited or any of its affiliates/ group companies shall not be in any way
responsible for any loss or damage that may arise to any person from any inadvertent error in the information contained in this report.
Angel Broking Limited has not independently verified all the information contained within this document. Accordingly, we cannot testify,
nor make any representation or warranty, express or implied, to the accuracy, contents or data contained within this document. While
Angel Broking Limited endeavors to update on a reasonable basis the information discussed in this material, there may be regulatory,
compliance, or other reasons that prevent us from doing so.
This document is being supplied to you solely for your information, and its contents, information or data may not be reproduced,
redistributed or passed on, directly or indirectly.
Neither Angel Broking Limited, nor its directors, employees or affiliates shall be liable for any loss or damage that may arise from or in
connection with the use of this information.
Disclosure of Interest Statement
Amber Enterprises India
1. Financial interest of research analyst or Angel or his Associate or his relative
No
2. Ownership of 1% or more of the stock by research analyst or Angel or associates or relatives
No
3. Served as an officer, director or employee of the company covered under Research
No
4. Broking relationship with company covered under Research
No
Ratings (Returns):
Buy (> 15%)
Accumulate (5% to 15%)
Neutral (-5 to 5%)
Reduce (-5% to -15%)
Sell (< -15%)
February 16, 2019
7